Caution
Rating icon - Chlorophyll a Rating icon - Total Nitrogen Rating icon - Total Phosphorous Rating icon - Dissolved Oxygen Saturation

3 out of 4 primary indicators were rated as PASS.

"Primary" are nutrient related (Chl, N, P) and bacteria (B) parameters.

All four indicators must pass for the creek to be rated as PASS.

Greyed out values indicate no data for the report year.

  • Size: 1,475 acres
  • Location: South Sarasota County
  • Discharges into: Lemon Bay

For more information, please see: Woodmere Creek Basin Master Plan (1999)

View county-wide water quality trends »

Woodmere Creek

Water Chemistry Ratings

Monitoring data is analyzed to determine stream health based on State water quality standards. Official determination of impairment or attainment of the water quality standards is performed by FDEP and is based on at least three years and up to seven and a half years of data. Information on approximately 17 different parameters are collected at stream sites, but only total nitrogen, total phosphorus, chlorophyll a, dissolved oxygen (percent saturation), and bacteria are assessed according to established water quality criteria mandated by the Clean Water Act. Additionally, the floral and faunal communities (SCI) are assessed at some sites to determine whether waters support a healthy aquatic community.

The "pass/fail" conditions presented here do not indicate impairment as determined by the official Florida Department of Environmental Protection Impaired Waters Rule assessment but, rather, give an indication of stream condition in a particular year in relation to the set regulatory numeric limits. Streams receive an annual "PASS" rating for each parameter if the mean value is below the regulatory value and a "FAIL" rating if the mean value exceeds the regulatory value. Not all water quality parameters have an established numeric criterion, so only some of the graphs below show the regulatory limit, represented by a horizontal red line.

Chart Legend
  • Monthly Average
  • Threshold
  • Annual Mean

The graphs here illustrate results over the past five years. Data from sites monitored within a single waterbody identification basin (WBID) are combined to determine water quality status for each WBID, and the annual geometric mean of sample results is indicated on the graph for the most recent year. The table to the left of the graph gives the annual and historic range of values for the indicator.

Click the graph to view a larger image and to download the full dataset.

Freshwater Portion of the Creek

Data for the following WBIDs is averaged when compiling the data below:
  • 2042

Chlorophyll a

Units: µg/l Year
2021
Historical
period of record
High 42.90
Mean 6.631 9.69868
Low 2.09
No. of Samples 0 24
  • Monthly Average
  • NNC 20.00 µg/l
  • Annual Mean

Nitrogen, Total

Units: mg/L Year
2021
Historical
period of record
High 3.599
Mean 1.4489 0.5784173
Low 1.052
No. of Samples 0 20
  • Monthly Average
  • NNC 1.65 mg/L
  • Annual Mean

Phosphorus, Total

Units: mg/L Year
2021
Historical
period of record
High 1.37
Mean 0.3941 0.26707437
Low 0.179
No. of Samples 0 22
  • Monthly Average
  • NNC 0.49 mg/L
  • Annual Mean

Dissolved Oxygen Saturation

Note: Dissolved oxygen saturation percentages above the regulatory threshold meet established water quality targets.
Units: percent (%) Year
2021
Historical
period of record
High 122.80
Mean 66.7 27.94745
Low 9.10
No. of Samples 0 23
  • Monthly Average
  • NNC 38.00 percent (%)
  • Annual Mean

BOD, Biochemical oxygen demand

Units: mg/l Year
2021
Historical
period of record
High 6.30
Mean 1.45 1.17401
Low 0.721
No. of Samples 0 22
  • Monthly Average
  • Annual Mean

Color

Units: PCU Year
2021
Historical
period of record
High 180.00
Mean 96.91 25.3874
Low 50.00
No. of Samples 0 24
  • Monthly Average
  • Annual Mean

Nitrogen, Ammonia + Ammonium as N

Units: mg/L Year
2021
Historical
period of record
High 0.575
Mean 0.01 0.13784491
Low 0.0001
No. of Samples 0 29
  • Monthly Average
  • Annual Mean

Nitrogen, Kjeldahl

Units: mg/L Year
2021
Historical
period of record
High 3.53
Mean 1.35 0.55361934
Low 1.02
No. of Samples 0 22
  • Monthly Average
  • Annual Mean

Nitrogen, Nitrite + Nitrate as N

Units: mg/L Year
2021
Historical
period of record
High 0.172
Mean 0.04 0.05519264
Low 0.004
No. of Samples 0 22
  • Monthly Average
  • Annual Mean

pH

Units: None Year
2021
Historical
period of record
High 7.72
Mean 7.4 0.17553
Low 7.01
No. of Samples 0 27
  • Monthly Average
  • Annual Mean

Salinity

Units: PSS Year
2021
Historical
period of record
High 0.43
Mean 0.3 0.07532
Low 0.18
No. of Samples 0 37
  • Monthly Average
  • Annual Mean

Specific conductance

Units: µmho Year
2021
Historical
period of record
High 892.00
Mean 634.13 158.92927
Low 376.00
No. of Samples 0 20
  • Monthly Average
  • Annual Mean

Temperature, water

Units: °F Year
2021
Historical
period of record
High 89.24
Mean 75.69 8.64027
Low 51.026
No. of Samples 0 22
  • Monthly Average
  • Annual Mean

Turbidity

Units: NTU Year
2021
Historical
period of record
High 28.00
Mean 4.28 5.92328
Low 1.50
No. of Samples 0 22
  • Monthly Average
  • Annual Mean
Other Measures of Creek Health:

Tidal Portion of the Creek

Data for the following WBIDs is averaged when compiling the data below:
  • 2042
Pass

Chlorophyll a

Score: Pass
Units: µg/l Year
2021
Historical
period of record
High 11.1 113.0
Mean 2.0162 4.1095 11.11252
Low 0.966 0.28
No. of Samples 12 532
  • Monthly Average
  • NNC 11.00 ug/l
  • Annual Mean

Nitrogen, Total

We were unable to determine a trend for the data available.
Units: mg/L Year
2021
Historical
period of record
High 2.9 7.4
Mean 1.2955 1.3048 0.67716323
Low 0.84 0.437
No. of Samples 12 412
  • Monthly Average
  • Annual Mean

Phosphorus, Total

We were unable to determine a trend for the data available.
Units: mg/L Year
2021
Historical
period of record
High 0.9 3.4
Mean 0.3601 0.5466 0.41875645
Low 0.253 0.18
No. of Samples 12 474
  • Monthly Average
  • Annual Mean
Caution

Dissolved Oxygen Saturation

Note: Dissolved oxygen saturation percentages above the regulatory threshold meet established water quality targets.
Score: Caution
Units: percent (%) Year
2021
Historical
period of record
High 97.2 225.9
Mean 37.81 49.24 29.07267
Low 1.80 1.80
No. of Samples 12 438
  • Monthly Average
  • NNC 56.00 percent (%)
  • Annual Mean

BOD, Biochemical oxygen demand

Units: mg/l Year
2021
Historical
period of record
High 1.2 19.5
Mean 1.01 1.08 1.41892
Low 1.00 0.50
No. of Samples 12 462
  • Monthly Average
  • Annual Mean

Color

Units: PCU Year
2021
Historical
period of record
High 160.0 400.0
Mean 96.04 95.92 26.35147
Low 60.00 5.00
No. of Samples 12 536
  • Monthly Average
  • Annual Mean

Enterococcus Group Bacteria

Units: MPN/100ml Year
2021
Historical
period of record
High 2,420.0
Mean 766.76 740.01414
Low 103.00
No. of Samples 0 19
  • Monthly Average
  • Annual Mean

Nitrogen, Ammonia + Ammonium as N

Units: mg/L Year
2021
Historical
period of record
High 0.2 1.4
Mean 0.02 0.02 0.16024067
Low 0.008 0.00
No. of Samples 12 526
  • Monthly Average
  • Annual Mean

Nitrogen, Kjeldahl

Units: mg/L Year
2021
Historical
period of record
High 2.3 7.3
Mean 0.91 1.06 0.65903816
Low 0.565 0.05
No. of Samples 12 474
  • Monthly Average
  • Annual Mean

Nitrogen, Nitrite + Nitrate as N

Units: mg/L Year
2021
Historical
period of record
High 0.8 1.2
Mean 0.36 0.13 0.18754425
Low 0.087 0.004
No. of Samples 12 472
  • Monthly Average
  • Annual Mean

pH

Units: None Year
2021
Historical
period of record
High 7.6 8.1
Mean 7.32 7.33 0.2133
Low 6.98 6.40
No. of Samples 12 535
  • Monthly Average
  • Annual Mean

Salinity

Units: PSS Year
2021
Historical
period of record
High 23.2 23.2
Mean 0.78 0.52 1.0632
Low 0.3754 0.02
No. of Samples 12 604
  • Monthly Average
  • Annual Mean

Specific conductance

Units: µmho Year
2021
Historical
period of record
High 38,871.0 44,845.0
Mean 1540.04 1048.9 4038.92509
Low 772.448 0.882
No. of Samples 12 444
  • Monthly Average
  • Annual Mean

Temperature, water

Units: °F Year
2021
Historical
period of record
High 180.4 180.4
Mean 167.12 76.81 22.5885
Low 145.1715 52.052
No. of Samples 12 454
  • Monthly Average
  • Annual Mean

Turbidity

Units: NTU Year
2021
Historical
period of record
High 150.0
Mean 2.88 11.7722
Low 0.20
No. of Samples 0 414
  • Monthly Average
  • Annual Mean
Other Measures of Creek Health:

Oysters

Because they are immobile and will tolerate a fairly wide salinity range, eastern oysters (Crassostrea virginica) are valuable as an indicator of the relative health of aquatic ecosystems in the tidally-influenced portions of coastal creeks. Sarasota County has established an oyster monitoring program to track the location, types, and status of oyster reefs. Data from this monitoring program is shown below. Learn more about Oysters »

Loading oyster site map...
Most Recent Sarasota County Oyster Monitoring Program Data
Icon Site ID Year Dead Live Total % Live

Impervious Features

Woodmere Creek is located within the Lemon Bay Watershed. View details about the Lemon Bay Watershed »

Rain that falls on land that is in a natural state is absorbed and filtered by soils and vegetation as it makes it way into underground aquifers. However, in developed areas, "impervious surfaces" impede this process and contribute to polluted urban runoff entering surface waters. These surfaces include human infrastructure like roads, sidewalks, driveways and parking lots that are covered by impenetrable materials such as asphalt, concrete, brick and stone, as well as buildings and other permanent structures. Soils that have been disturbed and compacted by urban development are often impervious as well. Learn more about Impervious Features »

The Sarasota County Stormwater Environmental Utility (SEU) mapped impervious surfaces in the County in 2013. A map showing impervious surfaces can be viewed using the Water Atlas Map Viewer tool.

21% of the land area within the Woodmere Creek Basin is covered by impervious surfaces

Impervious Surface Coverage by Type

Land Use / Land Cover

Woodmere Creek is located within the Lemon Bay Watershed. View details about the Lemon Bay Watershed »

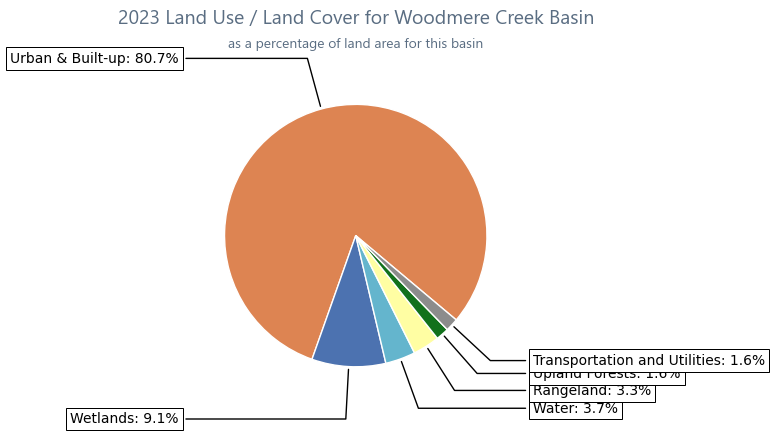
Land use within a creek's watershed has a major effect on its water quality. In general, less development means better water quality. Land Cover/Land Use classifications categorize land in terms of its observed physical surface characteristics (e.g. upland or wetland), and also reflect the types of activity that are taking place on it (agriculture, urban/built-up, utilities, etc.). Florida uses as its standard a set of statewide classifications which were developed by the Florida Department of Transportation. Learn more about Land Use and Land Cover »

Acreage and Percentage within each Land Use / Land Cover Category for Woodmere Creek Basin
Land Use Classification 1990 1995 1999 2005 2011 2014 2017 2020 2023 Trend
Urban & Built-up 98666.8% 1,05871.7% 1,08173.3% 1,18080% 1,19581% 1,19581% 1,19280.8% 1,19280.8% 1,19080.7% Land Use Trend Sparkline
Agriculture 00% 00% 00% 00% 00% 00% 00% 00% 00% Land Use Trend Sparkline
Rangeland 624.2% 251.7% 100.7% 332.2% 463.1% 463.1% 463.1% 463.1% 483.3% Land Use Trend Sparkline
Upland Forests 20714% 19613.3% 18312.4% 543.6% 241.6% 241.6% 241.6% 241.6% 241.6% Land Use Trend Sparkline
Water 342.3% 443% 473.2% 422.9% 523.5% 523.5% 553.7% 553.7% 553.7% Land Use Trend Sparkline
Wetlands 18712.6% 15110.3% 15110.3% 1439.7% 1359.1% 1359.1% 1359.1% 1359.1% 1349.1% Land Use Trend Sparkline
Transportation and Utilities 00% 10% 20.2% 241.6% 241.6% 241.6% 241.6% 241.6% 241.6% Land Use Trend Sparkline
Land Use Chart